We have completed the development of improved eduroam usage graphs. The enhancement to our reporting platform was required to improve the reporting functionality. We aimed to present the information in an easy-to-understand form, to allow gathering of insights around footfall, successful authentications, failed authentications, peak times, and much more.
Additionally, we wanted to allow you to access individually generated graphs for your institution with a more intuitive and interactive breakdown of eduroam usage.
What eduroam reporting looked like…
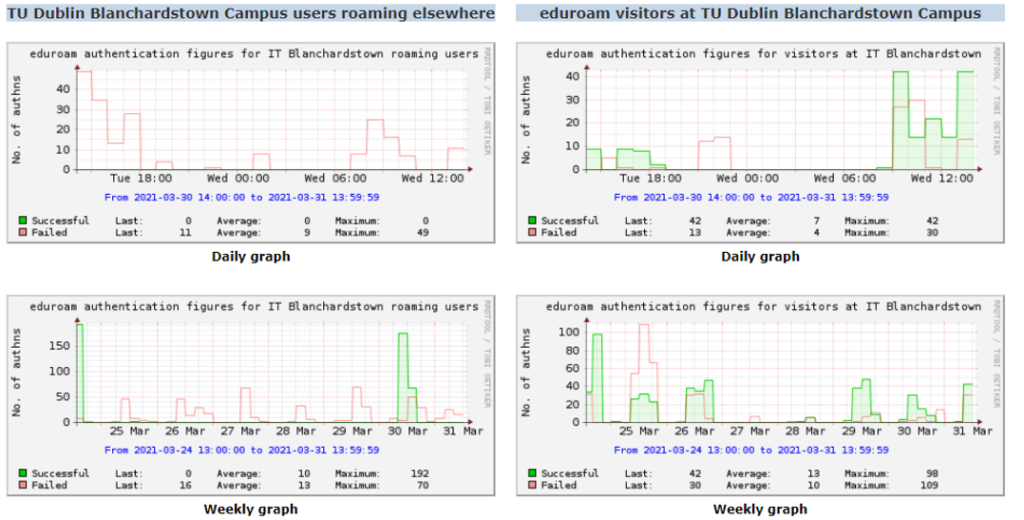
…What it looks like now: www.eduroam.ie/graphs
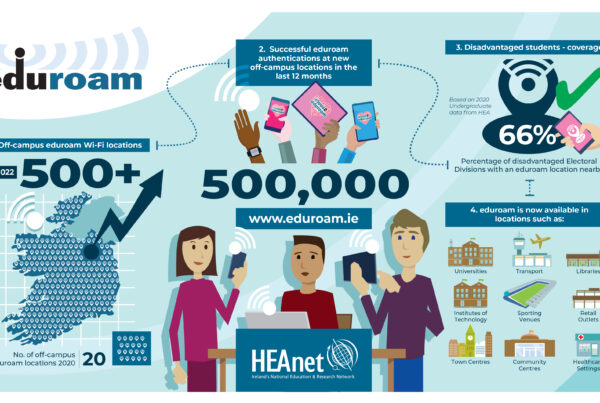
We would like to thank you for your ongoing support of the expansion of eduroam Wi-Fi. If you have any questions or if you would like to book a demo of our new graphs, please get in touch with eduroameverywhere@heanet.ie